How to create a Size Chart Table
Why do we need a Size Chart?
Displaying a Size Chart on product pages can help you boost conversion and reduce return rates.
According to a study by the Baymard Institute, 35.3% of online shoppers have abandoned a purchase because of a lack of size information.
With accurate size information available on the product page, customers are:
- Less likely to purchase the wrong size, which will result in fewer returns.
- More likely to make a purchase as they can be confident that the product will fit them well.
So don’t wait up. Enable the Size Chart App and optimize your product pages for higher conversion.
How to create a Size Chart Table
You can create multiple Size Charts and display them on specific products, collections, or all product pages.
1. Create a new size chart by clicking the Create Size Chart button.
2. Visibility: Select which product pages to show the size chart. You can display it on all product pages or specific collections or products.
By default, the size chart will be shown on all product pages. If you want to change this, in the Visibility section, click Select Products to open the selection modal and choose the products that you want. Then click Select Products.

3. Choose the option Create table to create a size chart from scratch

- Edit the size chart table in the Table Editor
- Enable the How to Measure editor (optional)
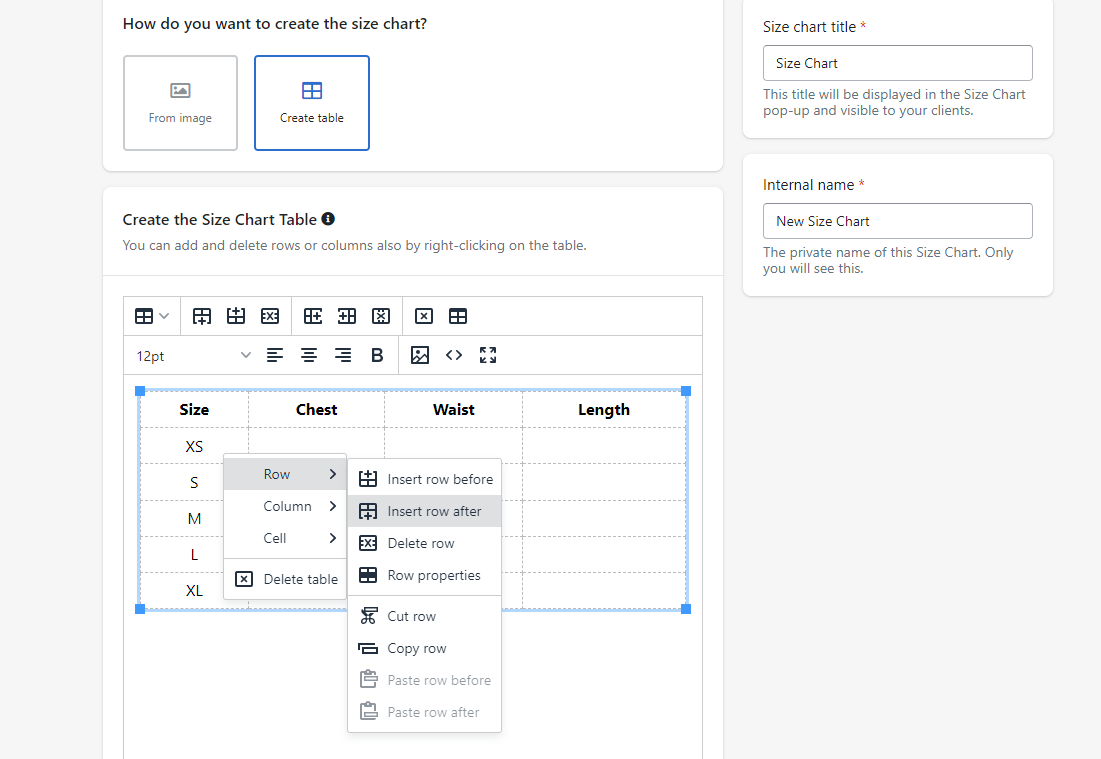
How to edit the table in the table editor
Add a new column or row
Right-click on the table to open the shortcuts menu. There you can select Row or Column and insert a row/column in the table. You can also add rows or columns using the table shortcuts.

Edit the size chart text
You can change the font size, align the text or use bold for header rows/columns.
Create a new table
You can create multiple tables in the editor.
Create a new table using the Table shortcut from the editor. You can choose visually how many rows and columns to start with. You can also add rows or columns after the table is created.

Delete table
You can delete the table using the Delete Table shortcut in the table editor or by right-clicking on the table and choosing Delete Table.
How to edit the Size Chart Table Style
You can change the style of the tables created in the Table editor.
Choose the global style applied to all size charts
- Go to Settings Tab
- Go to Table Style section
- Choose one of the layouts available
- Striped table with horizontal borders (this is the default option)
- Striped table with vertical borders
- Simple table
Style options from the Settings tab are applied globally to all size charts. These will only be reflected on the storefront and not in the table editor from the Create Size Chart page.
For the striped table, you can choose the striped row background color and the border color. For the simple table, you can change the border color.
For border thickness, you have 3 options:
- Light (0.5px)
- Regular (1px)
- Bold (2px)
The style changes mage in the Settings Tab will be applied globally to all size charts. If you want to style a particular size chart differently, use the advanced options available in the table editor.
How to style specific size charts differently
You can apply different styles for specific size charts, using advanced features from the Table editor. These will not be applied globally.
- Select the column/row you want to edit.
- Right-click on the table
- Click Cell > Cell Properties
- Go to the Advanced Tab
There you can change the border style, width, border color, and cell background.


Pro tip: If you use Advanced Properties to create a size chart style that you would like to use on other size charts, you can use the Duplicate button from the Size Chart list.
How to display and edit the How to Measure guide
Choose if you want to display also a measuring guide near the size chart. Here you can give helpful tips and information for the measuring process.
If you wish to show the guide, check the option Enable How to Measure Guide.

If you want to customize the measuring guide, you can edit the information directly in the editor.
You can change the text and the image shown in the how-to-measure guide.
If you want to change the layout or don't want to display an image in the how-to-measure guide, delete the content provided in the editor first.

You can upload your own images in the editor using the Upload Feature.

You can edit the style of the text using the options provided in the editor.

Choose where to display the how-to-measure guide in the Size Chart modal. You can place it below or above the size chart.
Publish the Size Chart
Publish the Size chart by clicking the Publish button. Make sure you enable the app. Or you can just Save the Size chart and change its status to Active.
Now the size chart should be visible on your store’s selected product pages. Don't forget to hard refresh the page to see the Size Chart button.
How are Size Charts Prioritized
Suppose multiple Size Charts target the same products. In that case, the most specific one will have priority over a more general one (e.g., a size chart for a specific product will have priority over a size chart on a collection or all products).
Also, the most recently updated will have priority. So if you have two size charts for the same products, the most recently updated will be displayed on the product page.
How to edit the style of the Size Chart Button
You can edit the style and text of the Size Chart button displayed on the product page.
- Go to the Settings Tab in the Button Style section.
- Choose the icon to display with the Size Chart Button text. If you don’t want any icons, choose the option No icon.
- Edit the text of the button if needed.
- Choose a color for the button. This setting controls the color of both the text and the icon.
- Choose if you want the size chart button text underlined or not. By default, it’s underlined, but you can uncheck this option.
How to Style the Size Chart Modal
- Go to the Settings Tab in the Modal style section.
- Choose the background color for the modal.
- Choose the text color for the modal. Ensure you have enough contrast, so your users can easily read the text.
How to Place the Size Chart Button
The Size Chart button is placed automatically near the Add to cart button on product pages.
You can change its placement using Vitals editor. You have the option to place the Size Chart button above or below the Add to Cart button from there.
If you wish, you can also place it in other locations on the product page using the Vitals Editor or the Shopify Theme Editor (if you have an OS 2.0 compatible theme).
Important note: If you want to place the Size Chart button right above or below the Add to cart button, use Vitals Editor, as you cannot do this from the Shopify Editor.